National fintech app · Sri Lanka
Case study · Meta Ads
Client confidential · Full case study on request
Tracking failed in week one. New cards still ran 66% above the month before.
How I kept a debit card relaunch accountable to cards, not clicks, after the client's app tracking stopped working.
+66%
cards/day
+66%
daily new cards in launch week vs the month before
42%
of app store visits went on to download the app
12%
of the budget recovered from an idle month and put back to work
A new-card target, a fixed budget and one month to hit it.
Every card meant six steps for the customer:
See the ad
Download
Register
KYC
Create card
Activate
A few days in, the client's tracking SDK stopped working. Meta could no longer see installs or cards.
The easy call was to pause. I kept it growing.
03 · The fix
I rebuilt the campaign around what we could still measure.
Sent every click to the store
A smart link, 25 merchant ad sets.
Built the missing measurement
KPI definition, funnel ratios, one source of truth.
Put idle budget to work
12% of the budget recovered from an idle month, and 10% moved to the merchant offers driving traffic.
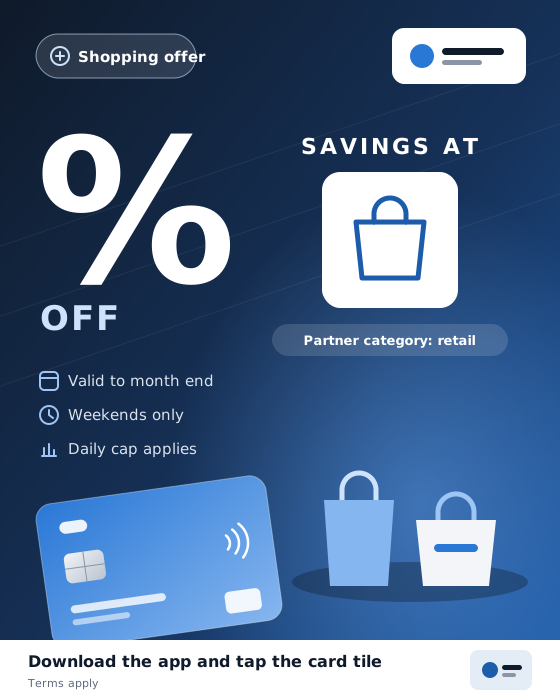
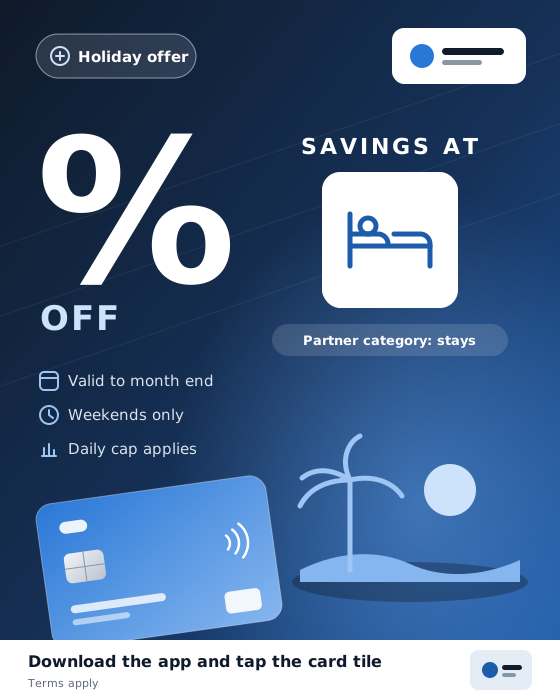
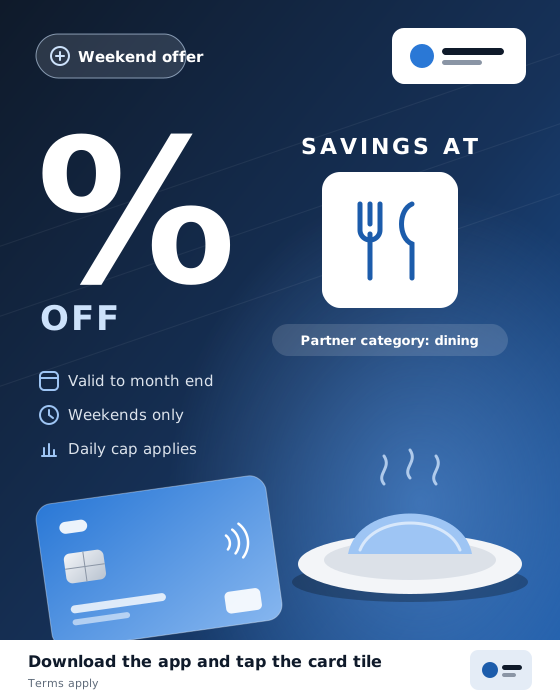
The ad format · one merchant offer per ad set
04 · The turning point
New cards ran 66% above the month before in launch week, and stayed above it.
Before
Baseline
Days 1–4 · launch
Days 5–8 · steady
When the budget was cut on day 4, results moved with it. The ads themselves held up.
Budget
Spend
Store visits
New cards
CTR stable
Cost per visit improved
So: the creative was still working
05 · The insight
The ads did their job. The next win is inside the app.
Cards moved with media spend, store visits came in cheaply, and about 4 in 10 visitors downloaded the app. To hit the card target on budget, about 1 in 21 store visits had to become a card. I gave the client that benchmark, so the next phase focuses on the steps inside the app: registration, KYC and card creation.
Store visits
100%
~42% went on to download the app
Downloads
~42%
Card creation inside the app: the biggest room to grow
New cards
Final count held by the client
−77%
budget cut mid-flight, and CTR held. The ads delivered efficient traffic.
~42%
of store visits became downloads. The ads brought the right people.
1 in 21
store visits becoming a card hits the target on budget. I set that benchmark for the app journey and mapped 3 ways to get there with the client.
What this says about how I work
I keep campaigns moving
even when the data breaks.
I find the cause
with numbers, not guesses.
I talk business outcomes
cards, not clicks.